
The US stock market officially became a ‘bear’ market this week, meaning the market has fallen 20% from the recent high. The Australian stock market has performed marginally better, being down 12% since the beginning of 2022.
Stock markets have fallen because investors are wary of an economic downturn driven by rising inflation. In turn, inflation is being driven by COVID-related disruptions to supply chains and the war in Ukraine impacting energy prices. In May, US inflation over the prior 12 months was 8.6% – the highest year-over-year growth since December 1981. The items most impacted by inflation have been petrol prices (+48.7%), airline fares (+37.8%) and gas utilities (+30.2%).
Interest rates are expected to rise to help curb inflation. Last week the Reserve Bank of Australia (RBA) increased the cash rate by 0.50% to 0.75% in response to our 12-month inflation rate being 5.1% to 31 March 2022. The cash rate is the benchmark against which home loan rates and term deposit rates are set.
The RBA expects inflation to increase further, perhaps to 6%, but then decline back towards its 2–3% target range in 2023. As the global supply-side problems are resolved and commodity prices stabilise, even if at a high level, inflation is expected to moderate.
The RBA noted the Australian economy is resilient, growing by 3.3% over the past year, and household and business balance sheets are generally in good shape with an upswing in business investment underway.
Whilst sudden market downturns can be unsettling, historically share market returns following sharp declines have been positive. A broad market index tracking data since 1926 in the US shows that stocks have tended to deliver positive returns over one-year, three-year, and five-year periods following steep declines. Cumulative returns show this trend to striking effect, as seen below.
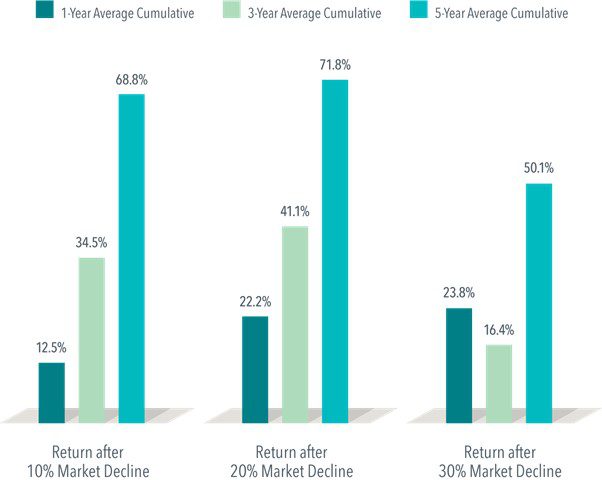
Source: Fama/French Total US Market Research Index Returns, July 1926-December 2021
On average, just one year after a market decline of 10%, stocks rebounded 12.5%, and a year after 20% and 30% declines, the cumulative returns topped 20%. Over three years, stocks bounced back more than 30% from declines of 10% and 20%, although—while still positive—returns were not as impressive after 30% declines. But five years after market declines of 10%, 20%, and 30%, the average cumulative returns all top 50%.
A look at the data makes a case for sticking with a plan. Handsome rebounds after steep declines can help put investors in a position to capture the long-term benefits the markets offer. When prices fall, the expected return goes up.
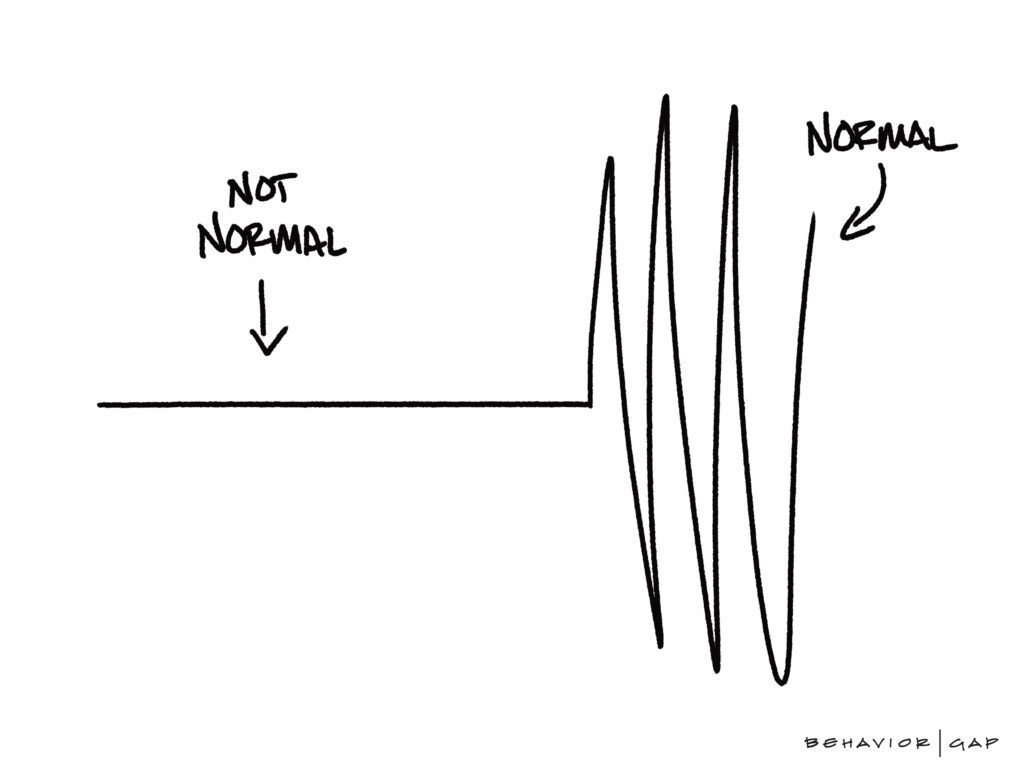
It has been unusual that we have experienced two market falls of 20%+ in the last two years. Historically, falls of this size have been more dispersed. Since 1939 there have been 16 market falls of 20% or more, this includes the pandemic drop two years ago. The current 20% fall is number 17. This equates to, on average, one 20% fall every 5 years. We would thus describe this current volatility as uncomfortable but normal. Whilst the catalyst for each market episode differed, there is no “new normal” to market volatility.
Whilst the timeframe varies, markets have always rebounded after these falls, and sometimes quickly. You need to ensure you are in your seat when the rebound arrives otherwise you can miss substantial returns.
A lot is happening in the world at present but staying the course with the investment strategy Alman Partners has created for you is the best decision. When developing your investment strategy, we expect and plan for times like these.
Contributed by friend of Alman Partners, Rick Walker of Lorica Partners.
Note: This material is provided for information only. No account has been taken of the objectives, financial situation or needs of any particular person or entity. Accordingly, to the extent that this material may constitute general financial product advice, investors should, before acting on the advice, consider the appropriateness of the advice, having regard to the investor’s objectives, financial situation and needs. This is not an offer or recommendation to buy or sell securities or other financial products, nor a solicitation for deposits or other business, whether directly or indirectly.
Performance data shown represents past performance or simulated performance. Past performance is no guarantee of future results and current performance may be higher or lower than the performance shown. The investment return and principal value of an investment will fluctuate so that an investor’s shares, when redeemed, may be worth more or less than their original cost.