Well, here we are again with yet another event that will impact markets and therefore your portfolios. Before I put these things into perspective from a financial point of view, I do want to acknowledge that events like these are terrible for the world at large. The uncertainty, fear and noise can unsettle us all, and there will be impacts to markets as we are seeing.
Our role as a trusted adviser at these times is to be the voice of reason, ensuring our clients do not make wealth-destroying decisions. It’s not about predicting what comes next, it’s about being prepared for it! We ensure that our client’s portfolios are positioned to weather these inevitable events while allowing them to continue achieving their short, medium, and longer-term goals.
Clients deserve to have confidence that ‘no matter what happens in the markets, the economy or the world, they have the highest probability of achieving their most important goals.’
Alman Partners do not judge markets or investment success over the short term but over decades, and our client’s individual portfolio asset allocations are designed specifically for their unique situation.
Now, having said that let’s quieten down the noise of this event and look at how markets have, over various decades, performed while enduring extreme events. We will start with the past decade following the GFC, then I will show you market returns over each decade in the past 115 years.
We really encourage you to continue to read this extended article which will demonstrate that markets recover from extreme events and reward discipline.
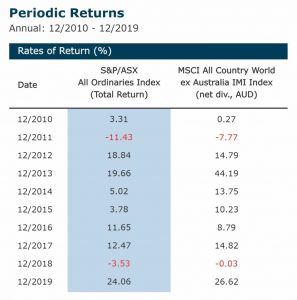
Imagine it is early January 2010 and you are reading a review of the financial markets. Investors have been on a roller coaster over the past three years, living through the stress of the Global Financial Crisis and market downturn of 2008–2009, then experiencing the recovery that began in March 2009 and is still going strong. Investors who rode out the market’s slide are beginning to be rewarded.
Then guess what? The next 2 years produce a negative return! What do you do now, move to cash? 2012 & 2013 show once again that market rebounds happen, and they happen quickly.
Now, fast forward to today and consider what the local & global equity markets delivered to investors who stayed the course over the whole decade with the last calendar year the best out of the ten years. They doubled their money.
Periodic Returns
Monthly: 12/2010 – 12/2019
Past performance is not a guarantee of future results.
Returns are calendar year including dividends.
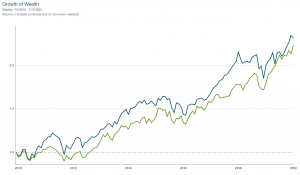
On a total return basis, global stocks more than doubled in value from 2010–2019, as the graph below shows. The MSCI All Country World IMI Index, which includes large and small-cap stocks in developed and emerging markets, had a 10-year annualised return of 8.91%. From a growth-of-wealth standpoint, $10,000 invested in the stocks in the index at the beginning of 2010 would have grown to $23,473 by year-end 2019. With Aussie equities not too far behind.
Growth of Wealth
Monthly: 1/1/2010 – 31/1/2020
Returns in multiple currencies and no conversion selected.
– MSCI All Country World ex Australia Index
– S&P/ASX All Ordinaries Index (Total Return)
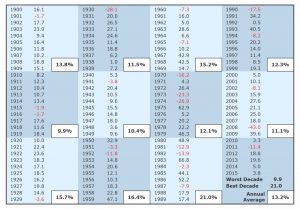
Below is the equity returns from the Australian Share Market each decade over 115 years with all dividends reinvested. Considering we had 2 World Wars during this time, I think this is a good case for staying the course with a well-engineered asset allocation.
So here we are in 2020, and out of the blocks is the Coronavirus outbreak. Just like back in January 2010 when investors were faced with incredible uncertainty for the decade before them, we do not know what the future will hold.
What we do know is applying the fundamentals we consistently apply to our investment philosophy of appropriate asset allocation, broad diversification and remaining seated in markets over the long term generally irons out the challenges we face over the decades.
Alman Partners Pty Ltd, Australian Financial Services Licence No: 222107.
Performance data shown represents past performance or simulated performance. Past performance is no guarantee of future results and current performance may be higher or lower than the performance shown. The investment return and principal value of an investment will fluctuate so that an investor’s shares, when redeemed, may be worth more or less than their original cost.


