
The Australian Election held on May 21st generates lots of views and news, but one thing that is rarely talked about is what effect elections have on financial markets? And this may surprise many people, but the reason that it’s not normally part of the election debate is because, well, elections don’t actually have any impact on the stock market!
This is not necessarily because financial markets don’t take elections into account. But the truth is that elections are just one of many factors that drive prices of securities. And it is very hard to separate any one of those myriad factors from the others.
The issues that move financial markets have more to do with rising measures of consumer price inflation, the removal of emergency policy stimulus by central banks and Russia’s invasion of Ukraine.
Of course, it is in the interests of politicians of either side to claim they ‘manage’ the economy and to talk up the dire consequences of what would happen if their opponents took power. But markets to date have not been showing any disquiet either way.
There is very little evidence from history either that election wins from one major party or the other has a definitive impact on the local share market, separate from all the other things that are going on at the time of the election.
The chart below shows the frequency of monthly returns of a broad-based Australian equity benchmark in the months when Australia elections were held over the past 50 years, going back to the election of the Whitlam government in 1972.
The red marks represent months the Australian Labor Party won. The blue marks represent months the Liberal-National Coalition won. The grey marks represent non-election months over this half-century period. Dashes representing returns of a given month are stacked in ascending order of return within each column, with the highest return within that range on top.
In this time, there were 19 Australian federal elections, of which 10 were won by the Coalition and 9 by Labor. The chart shows election month returns have been well dispersed throughout the range of outcomes, with no clear pattern based on which party won.
For instance, the single worst result in this sample was the election held in May 1974, won by Labor under Gough Whitlam and a month in which the local share market fell more than 14%.
But then the single best result was also an election won by Labor under Bob Hawke in July 1987, when the market rose by more than 14%.
Of course, other things were also happening in both those years. From 1973-74, for instance, global equity markets were suffering one of their worst downturns following the collapse of the Bretton Woods system of fixed currencies and a global oil shock.
Figure 1: Distribution of Monthly Returns
MSCI Australia Index, January 1970 – April 2022
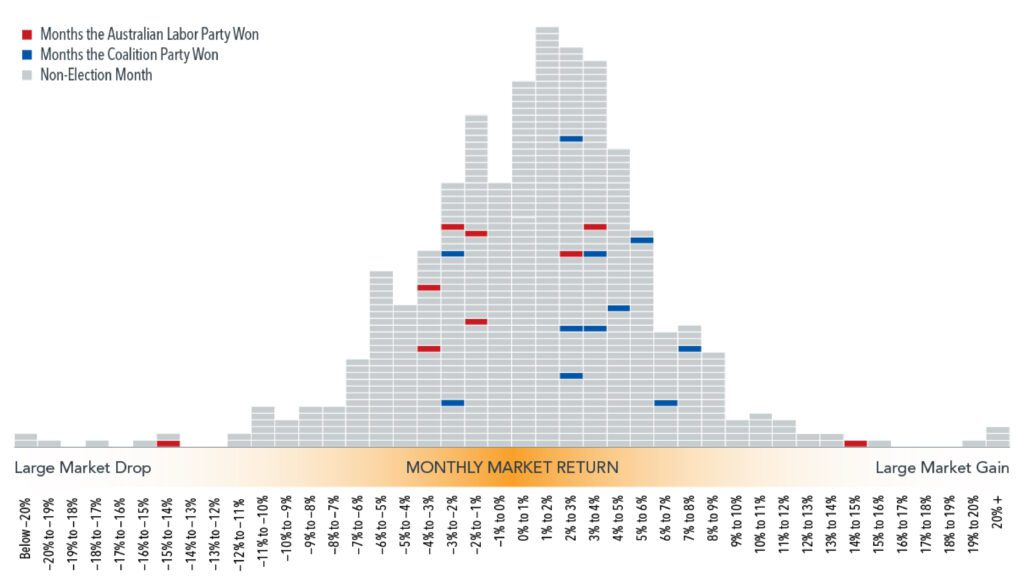
Chart from Dimensional Fund Advisors, April 2022
In 1987, global share markets were coming to the end of a five-year bull run that ended in October that year with the so-called Black Monday crash.
The point is that at any one time, there is news coming from many different directions – from company earnings to economic data to geopolitical events to policy and regulatory changes.
It is natural for investors to look for a connection between who wins power in Canberra and which way stocks will go. But shareholders are investing in a company, not a political party. And companies focus on serving their customers and helping their businesses grow, regardless of who is in government.
What this means is that making investment decisions based on the predictions of election outcomes or actual outcomes is unlikely to result in reliable excess returns. On the contrary, it may lead to costly mistakes.
Ultimately, this adds up to a strong case for relying on a consistent approach to your asset allocation—making a long-term plan and sticking to it.
Dr Steve Garth (PhD (AppMaths), BSc (MathsPhys), BA (Majoring in History & Politics), MAppFin, GradDipBusAdmin) is an Independent Member of Alman Partners’ Investment Committee.
Performance data shown represents past performance or simulated performance. Past performance is no guarantee of future results and current performance may be higher or lower than the performance shown. The investment return and principal value of an investment will fluctuate so that an investor’s shares, when redeemed, may be worth more or less than their original cost.
Note: This material is provided for GENERAL INFORMATION ONLY. No account has been taken of the objectives, financial situation or needs of any particular person or entity. Accordingly, to the extent that this material may constitute general financial product advice, investors should, before acting on the advice, consider the appropriateness of the advice, having regard to the investor’s objectives, financial situation and needs. This is not an offer or recommendation to buy or sell securities or other financial products, nor a solicitation for deposits or other business, whether directly or indirectly.